
The following article was originally posted on July 31, 2014 by Gary Rubeinstein. We are sharing it with the kind permission of the author.
The Achievement School District (ASD) in Tennessee is an attempt to replicate the ‘success’ of the Recovery School District (RSD) in Louisiana. The main difference is that while Louisiana’s RSD was set into action because of a natural disaster, Hurricane Katrina, Tennessee’s ASD was set into action because of a man made disaster, Hurricane Kevin Huffman, the commissioner of education in Tennessee, and an old acquaintance of mine from the days when we were both in TFA in Houston in the early 1990s. (I was Houston 1991 and Huffman was Houston 1992). In charge of the ASD is someone who was a good friend of mine back in Houston, Chris Barbic. Chris started the YES chain of charter schools.
The goal of the ASD is to take the bottom 5% of schools in Tennessee and in five years transform them into schools that are in the top 25% of schools in Tennessee. As Tennessee schools are supposedly all improving at record rates, this would require that the ASD school progress at much faster rates to get from the bottom to near the top.
Last year I wrote my first annual report on the status of the ASD in a post called The Underachievement School District. At that time, they boasted that they got the highest growth score possible, a 5 out of 5, but also revealed that their reading scores dropped from 18.1% proficient in 2012 to 13.6% proficient in 2013 while the rest of the state rose from 49.9% proficient to 50.3% proficient. I questioned the validity of the five point growth scale based on these numbers.
The state tests in Tennessee are called the TCAPs. This year there was a fiasco where the TCAP score release was delayed so long that schools were not able to use the scores in the student’s grades. Tennessee is all about ‘accountability’ so this was one more straw that made parents and also Republican state legislators to call for Huffman’s resignation.
Early July 2014, I wrote about how the state released a summary of the TCAP scores. It was revealed that 3-8 math increased by less than 1% while 3-8 reading went down by less than 1%. Nothing to celebrate there. Instead they focused on supposed high school ‘gains.’ This was ironic to me since Tennessee was so proud of their grade 4 and grade 8 NAEP gains yet when the 12th grade NAEP showed that Tennessee didn’t do so well there, they said that they can’t be held responsible for high schoolers since those students had most of their academic careers before the reforms set it. So they can’t take blame when high schoolers do poorly, but they will take the credit when they do well.
Tennessee is releasing TCAP results in stages. The big picture came out around July 4th, the school results are coming, they say, around August 15th, and the district results were released today, July 30th. With the release of the district data, they also had some press releases telling the newspapers what to say. In the whole country I’d say that the education reporters in Tennessee are the worst. They just take whatever the press releases say and print that without any delving into the numbers themselves. It is a shame I have to do their job for them, but I guess someone’s got to do it.
With the release of the district data, there are the Louisiana style invented statistics like this one:
So I was interested to see how the ASD fared. Looking over their scores, 21.8% passing 3-8 math and 17% passing 3-8 reading, the first thing I looked for is what sort of progress they are making in going from the bottom 5% to the top 25% in five years. Two years in and they are still in the bottom 5%, dead last with the second to last district not even close to them. They will surely have to pick up the pace on their growth.
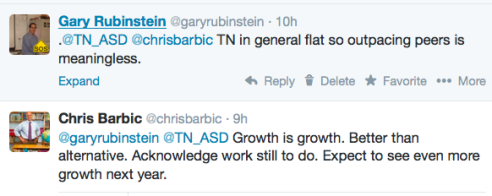
Then I saw this tweet
The goal of the ASD is to take the bottom 5% of schools in Tennessee and in five years transform them into schools that are in the top 25% of schools in Tennessee. As Tennessee schools are supposedly all improving at record rates, this would require that the ASD school progress at much faster rates to get from the bottom to near the top.
Last year I wrote my first annual report on the status of the ASD in a post called The Underachievement School District. At that time, they boasted that they got the highest growth score possible, a 5 out of 5, but also revealed that their reading scores dropped from 18.1% proficient in 2012 to 13.6% proficient in 2013 while the rest of the state rose from 49.9% proficient to 50.3% proficient. I questioned the validity of the five point growth scale based on these numbers.
The state tests in Tennessee are called the TCAPs. This year there was a fiasco where the TCAP score release was delayed so long that schools were not able to use the scores in the student’s grades. Tennessee is all about ‘accountability’ so this was one more straw that made parents and also Republican state legislators to call for Huffman’s resignation.
Early July 2014, I wrote about how the state released a summary of the TCAP scores. It was revealed that 3-8 math increased by less than 1% while 3-8 reading went down by less than 1%. Nothing to celebrate there. Instead they focused on supposed high school ‘gains.’ This was ironic to me since Tennessee was so proud of their grade 4 and grade 8 NAEP gains yet when the 12th grade NAEP showed that Tennessee didn’t do so well there, they said that they can’t be held responsible for high schoolers since those students had most of their academic careers before the reforms set it. So they can’t take blame when high schoolers do poorly, but they will take the credit when they do well.
Tennessee is releasing TCAP results in stages. The big picture came out around July 4th, the school results are coming, they say, around August 15th, and the district results were released today, July 30th. With the release of the district data, they also had some press releases telling the newspapers what to say. In the whole country I’d say that the education reporters in Tennessee are the worst. They just take whatever the press releases say and print that without any delving into the numbers themselves. It is a shame I have to do their job for them, but I guess someone’s got to do it.
With the release of the district data, there are the Louisiana style invented statistics like this one:
- From 2011 to 2014, the percentage of districts with the majority of their students proficient or advanced in 3-8 math increased from 18 percent to 57 percent.
So I was interested to see how the ASD fared. Looking over their scores, 21.8% passing 3-8 math and 17% passing 3-8 reading, the first thing I looked for is what sort of progress they are making in going from the bottom 5% to the top 25% in five years. Two years in and they are still in the bottom 5%, dead last with the second to last district not even close to them. They will surely have to pick up the pace on their growth.
Then I saw this tweet
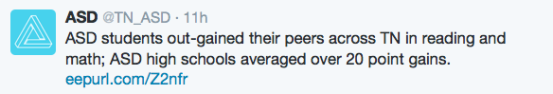
and thought, “that’s interesting.” The link led me to a pathetic attempt to dress up the horrible numbers posted by the ASD this year. I went to the link and found a page with the headline “ASD Grows Faster than State in Reading and Math, High Schools Make Double Digit Gains.”
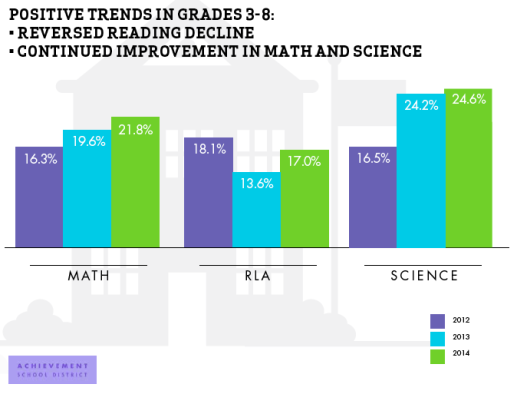
They included this bar graph showing their ‘growth’ over the past two years in math, ELA, and science. I noticed that while they technically did ‘gain’ 3.4% in their reading scores, they are still 1.1% down from what they were in 2012. This reminds me a bit of a guy who is gambling and you ask him how he’s doing and he says “I’m up $1,000 in the past hour without mentioning the $1500 he lost in the hour before that.” Also these bars since they are only being compared to each other do not make it clear how low these scores really are.
They included this bar graph showing their ‘growth’ over the past two years in math, ELA, and science. I noticed that while they technically did ‘gain’ 3.4% in their reading scores, they are still 1.1% down from what they were in 2012. This reminds me a bit of a guy who is gambling and you ask him how he’s doing and he says “I’m up $1,000 in the past hour without mentioning the $1500 he lost in the hour before that.” Also these bars since they are only being compared to each other do not make it clear how low these scores really are.
But in reform, when convenient, it’s not about score it’s about ‘growth’ compared to the rest of the state. Well since from 2013 to 2014 the whole state went down by .4% in reading, any ‘growth’ no matter how little by a district is ‘out-gaining’, as the tweets said, their peers. And since math across the state was flat from 2013 to 2014, rising only by .6%, almost any other possible gain by a district will be better than the state. Still it made for this impressive looking graph comparing ASD growth to state growth.
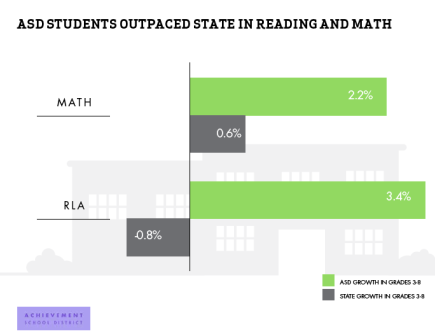
Of course the 2.2% bar is quite large the way they did their scale. But it is accurate that the ASD had better growth than the state between 2013 and 2014. But the ASD has been around for two years, so wouldn’t it make more sense to compare the ‘growth’ of the ASD to the whole state for the two year period. Well, they were wise not to, but I was wise to make it for them, and here’s what it looks like:
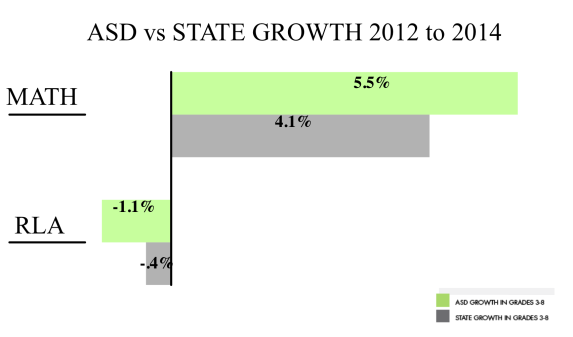
Suddenly, it’s not so good anymore. The ASD grew by 1.1% more than the state in that period while the RSD actually went down by .7% more than the state went down. At this rate of losing .35% of ground each year to the state, the ASD will never get out of the bottom 5% in reading, and for math where there is a 30% difference between the ASD and the Tennessee average, if they creep up at .5% a year it will take 60 years for them to get to the 50% mark, let alone the top 25%. Here is another graph I made that you won’t find in the press release. The are those proficiency numbers of the ASD side by side with the Tennessee average.
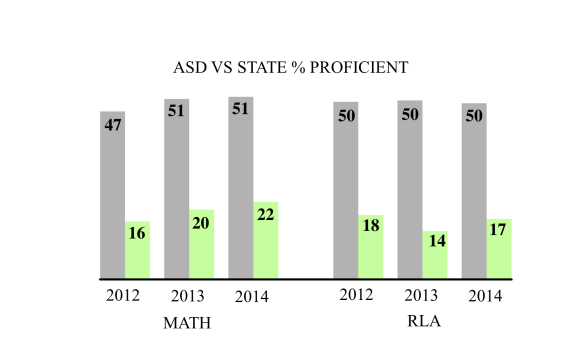
This demonstrates, as much as anything how the fact that the ASD had a better 1 year ‘growth’ than the state, the two year growth is about the same and that the ASD better start ramping it up if they plan to get their schools from way way back in dead last to beating 75% of the districts in the state of Tennessee in just three years.
But there does need to be something to celebrate so the ASD made up the most outrageous statistic of all and presented it in this graph.
But there does need to be something to celebrate so the ASD made up the most outrageous statistic of all and presented it in this graph.
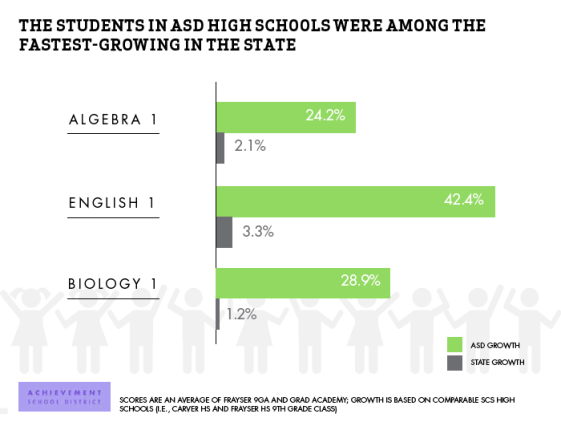
According to this graph it seems that ASD high schools had 42.4% ‘growth’ in English 1, 24.2% ‘growth’ in Algebra 1, and 28.9% ‘growth’ in Biology 1. Whoah, those are big numbers. When I went to the page with all the databases I found that there were no numbers at all for the ASD. Other districts had ‘growths’ generally between -10% and +10%. But why no ASD? Then I noticed in the fine print on this graph the very mysterious explanation:
SCORES ARE AN AVERAGE OF FRAYSER 9GA AND GRAD ACADEMY; GROWTH IS BASED ON COMPARABLE SCS HIGH SCHOOLS (I.E., CARVER HS AND FRAYSER HS 9TH GRADE CLASS)
I’ll give a hearty thumbs up to any Tennessee education reporter who gets to the bottom of what this could possibly mean.
As I mentioned at the beginning of this post, I was once good friends with Chris Barbic, and maybe he still sees me as a good guy, though an annoying one. I hope so. A year and a half ago he was the recipient of one of my ‘classic Rubinstein’ open letters. I write him emails from time to time, mostly yelling at him for having become a ‘reformer.’ He hasn’t written me back in a while, actually. But from time to time he will respond to one of my tweets. I’ll then tweet back and a bunch of others will usually join in and then Chris, like the groundhog seeing his shadow, but this time it is him seeing his own reflection, and he goes into hiding for a few months.
This concludes this edition of the 2014 report on the Achievement School District. For sure there will be three more of these 2015, 2016, and 2017. After that I will determine if the ASD has met their goal of getting the bottom 5% of schools up to the top 25% in just 5 years armed with only a healthy dose of high expectations and a whole bunch of new TFA teachers.
Tennessee parents hope that legislators and decision-makers are not so gullible as to fall for the ASD's manipulated data and pretty graphs. But we are afraid they are...
Just yesterday in the Tennesseean newspaper, it was reported that the State-led district expects to take over even more Nashville schools over the next 2 years. The newspaper even printed the undeniable fact that Reading scores for the ASD are still not back to the levels they were at prior to the ASD takeover of schools in 2012. Wow. That is a whole lot of disruption to those students, teachers, and communities for results that are worse than they were before the ASD took over! Plus, the citizens in these ASD communities have indefinitely lost local control and representation through an elected school board.
Who is this system really benefiting? Follow the money.
 RSS Feed
